
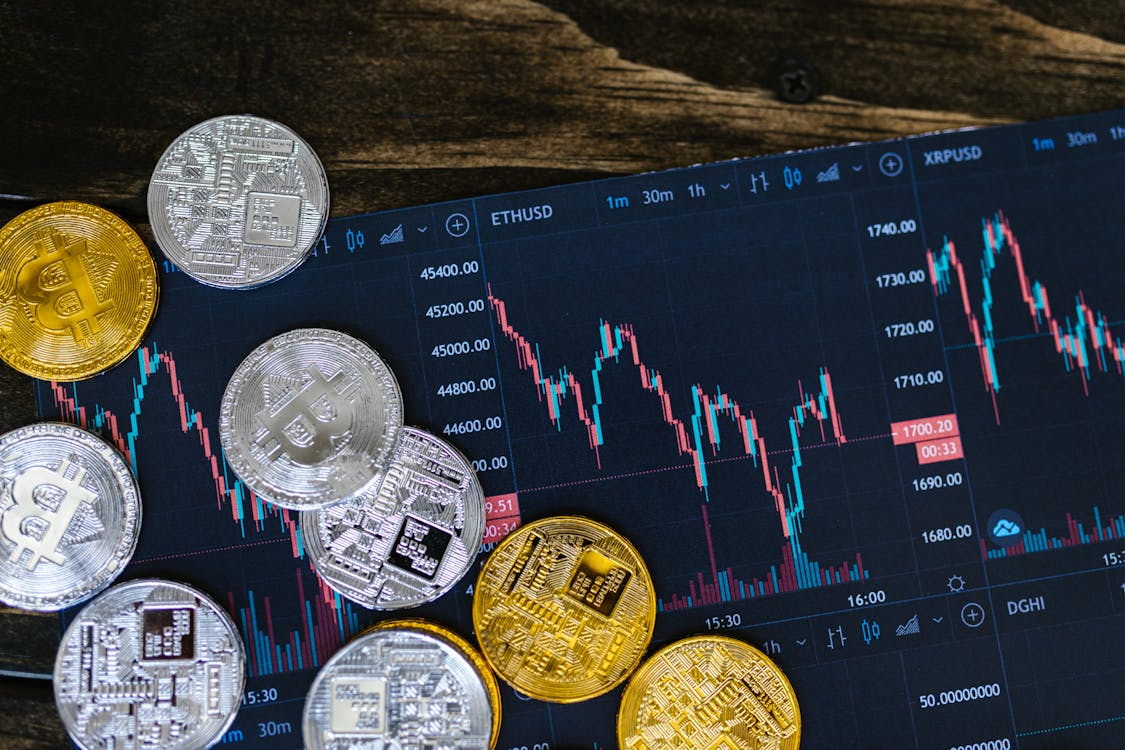
Blockchain data provides unprecedented transparency into market participant behavior
My Journey: From Traditional Analysis to Blockchain Intelligence
I remember my first encounter with Bitcoin back in 2017. Like many newcomers, I approached crypto trading with traditional technical analysis tools—moving averages, RSI, MACD. While these provided some edge, I constantly felt like I was missing crucial information. The breakthrough came when I discovered on-chain analytics and realized that blockchain data offered something unprecedented in financial markets: complete transparency.
Unlike traditional markets where institutional movements are often hidden in dark pools and reported weeks later, blockchain transactions are publicly visible in real-time. This transparency became my secret weapon. I began tracking whale wallets, monitoring exchange flows, and analyzing network health metrics. The patterns I uncovered transformed my trading approach entirely.
In this guide, I'll walk you through my complete framework for incorporating blockchain data into smart money analysis. From basic concepts to advanced strategies, you'll learn how to read the blockchain like a professional analyst and make more informed trading decisions.
Understanding Smart Money in Crypto Markets
Smart money refers to the capital controlled by institutional investors, venture funds, market makers, and sophisticated traders who typically have better information, resources, and timing than retail participants. In traditional markets, identifying smart money movements is challenging, but blockchain technology changes this dynamic completely.

Tracking smart money requires understanding both market structure and on-chain behavior
Characteristics of Crypto Smart Money
Through years of observation, I've identified several key characteristics of smart money in cryptocurrency markets:
- Patient Capital: Smart money accumulates during fear and distributes during greed, often holding through volatility
- Strategic Positioning: They enter positions before major catalysts and exit before market tops
- Multi-timeframe Approach: Combining short-term tactical trades with long-term strategic holdings
- Information Edge: Access to better data, research, and market intelligence
- Risk Management Focus: Strict position sizing and risk controls across all investments
Why Blockchain Data Reveals Smart Money
The fundamental advantage of blockchain analysis stems from these key attributes:
| Aspect | Traditional Markets | Blockchain Markets |
|---|---|---|
| Transaction Transparency | Limited, delayed reporting | Complete, real-time visibility |
| Position Tracking | Quarterly filings (45-day delay) | Real-time wallet monitoring |
| Market Depth | Hidden order books, dark pools | Visible order books, mempool data |
| Whale Identification | Difficult, often anonymous | Wallet clustering, behavior analysis |
Advantages of Blockchain Analysis
- Real-time tracking of large transactions
- Identification of accumulation/distribution patterns
- Early warning signals for market moves
- Transparent verification of network health
- Objective data without reporting delays
Limitations to Consider
- Privacy coins and mixers can obscure tracking
- Wallet identification isn't always perfect
- Data overload can lead to analysis paralysis
- Requires technical understanding of blockchain
- False signals from exchange internal transfers
Essential Blockchain Metrics for Smart Money Analysis
Over time, I've developed a framework focusing on specific blockchain metrics that provide the most actionable insights. Here are the core metrics I monitor daily:
Network Health Metrics
These metrics help me understand the fundamental strength of a blockchain network:
Network Value to Transactions (NVT) Ratio
Often called the "PE ratio" of crypto, NVT compares market cap to transaction volume. When NVT is high, the network may be overvalued relative to its utility. When low, it may be undervalued. I've found divergences between price and NVT to be particularly powerful signals.
Active Addresses
The number of unique addresses active as senders or receivers. Growing active addresses typically precede price appreciation, while declining activity often signals distribution phases. I track both absolute numbers and growth rates.
Hash Rate and Staking Metrics
For Proof-of-Work chains, hash rate indicates network security and miner commitment. For Proof-of-Stake, staking participation shows validator confidence. Significant changes in these metrics often foreshadow price movements.
Exchange Flow Metrics
Exchange movements provide crucial insights into market sentiment and potential price pressure:
Exchange inflows and outflows reveal accumulation and distribution patterns
- Exchange Inflows: Large inflows often signal impending selling pressure as investors move coins to exchanges to sell
- Exchange Outflows: Significant outflows typically indicate accumulation as investors move coins to cold storage
- Exchange Whale Ratio: The percentage of large transactions going to exchanges. Spikes often precede market downturns.
- Stablecoin Flows: Monitoring stablecoin movements helps gauge buying power waiting on the sidelines
Whale and Institutional Metrics
Tracking large holders provides direct insight into smart money behavior:
| Metric | What It Measures | My Interpretation |
|---|---|---|
| Whale Transaction Count | Number of large transactions (>$100k) | Increased activity often precedes volatility |
| Supply Distribution | Percentage held by different wallet sizes | Concentration vs decentralization trends |
| Whale Accumulation | Net position changes of largest wallets | Smart money buying/selling patterns |
| Entity-Adjusted Flows | Consolidated wallet activity | More accurate than raw transaction counts |
My Practical Framework for Blockchain Analysis
Developing a systematic approach to blockchain analysis transformed my results from sporadic insights to consistent edges. Here's the framework I use daily:
Step 1: Macro Network Assessment
I start each analysis session by examining the overall health of the blockchain network. This includes checking active addresses, transaction volume, and network value metrics. I'm looking for divergences between network activity and price action—these often signal impending moves.
Step 2: Exchange Flow Analysis
Next, I examine exchange flows across major platforms. I pay particular attention to net flows (inflows minus outflows) and whether large transactions are dominating the movement. Sustained net outflows during price consolidation often signal smart money accumulation.
Step 3: Whale Wallet Monitoring
I maintain a watchlist of known institutional wallets, exchange cold wallets, and large individual holders. By tracking their movement patterns, I can identify when smart money is accumulating or distributing. I've found that coordinated movements across multiple whale wallets often precede significant price moves.

Advanced analytics platforms help visualize complex on-chain data relationships
Step 4: Mining and Staking Behavior
For Proof-of-Work assets, I monitor miner flows—when miners are selling reserves versus holding. For Proof-of-Stake assets, I track staking participation rates and validator behavior. Changes in these metrics often reflect insider confidence or concerns.
Step 5: Derivatives and Leverage Analysis
While not strictly on-chain, I incorporate derivatives data from platforms that provide transparency into futures open interest, funding rates, and liquidations. Combining this with on-chain data creates a more complete picture of market structure.
My Biggest "Aha!" Moment with Blockchain Data
In early 2023, I noticed a fascinating divergence: Bitcoin price was stagnating around $23,000, but exchange outflows were accelerating, with particularly large movements from known institutional wallets. Meanwhile, the number of addresses holding 100+ BTC was steadily increasing. This clear accumulation pattern contradicted the fearful market sentiment at the time.
Trusting the blockchain data over market sentiment, I increased my position significantly. Over the next three months, Bitcoin rallied over 80%. This experience cemented my belief in blockchain analysis as a powerful tool for identifying smart money movements before they're reflected in price.
Essential Tools for Blockchain Analysis
Having the right tools is crucial for effective blockchain analysis. Here are the platforms and resources I rely on:
Glassnode
My primary platform for comprehensive on-chain metrics, institutional flows, and advanced charting. Their entity-adjusted data is particularly valuable for filtering out noise.
Chainalysis
Excellent for tracking exchange flows and identifying wallet clusters. Their Reactor tool helps trace transaction paths across the blockchain.
CryptoQuant
Great for real-time exchange flows, miner movements, and whale tracking. I use their alerts for immediate notification of significant movements.
Nansen
Superior for Ethereum and DeFi analysis. Their smart money dashboard helps identify what sophisticated investors are buying and selling.
Dune Analytics
Perfect for creating custom queries and dashboards. I've built several proprietary metrics using their platform.
Token Terminal
Essential for fundamental analysis of DeFi protocols and blockchain applications. Tracks revenues, users, and economic activity.
Case Study: Tracking Institutional Accumulation
Let me walk you through a real example of how I used blockchain data to identify a major accumulation phase:
The Setup: Q4 2022 Market Bottom
Following the FTX collapse in November 2022, crypto markets were in extreme fear. Bitcoin had dropped from $69,000 to under $16,000, and sentiment was overwhelmingly negative. However, several blockchain metrics began flashing bullish divergences:
- Exchange Outflows: Bitcoin was leaving exchanges at the fastest rate in over a year
- Whale Accumulation: Addresses holding 1,000+ BTC were growing steadily
- Long-term Holder Metric: The percentage of supply held by long-term investors reached all-time highs
- Miner Position Index: Miners were holding rather than selling, despite price pressure
My Analysis and Action
Despite the negative price action and fearful sentiment, the blockchain data told a different story: smart money was accumulating aggressively. I positioned accordingly, establishing core positions while maintaining dry powder for potential further downside.
The Result
Over the next six months, Bitcoin rallied over 150%, validating the accumulation signals I'd identified through blockchain analysis. This case study exemplifies why I trust on-chain data over short-term price movements and market sentiment.
"Blockchain data doesn't care about sentiment, news, or narratives. It reveals what's actually happening beneath the surface—where capital is flowing, who's accumulating, and when market structure is shifting. This objective reality is the most valuable edge in crypto markets."
Advanced Techniques: Combining On-Chain with Other Data
While powerful on its own, blockchain analysis becomes even more potent when combined with other data sources:
On-Chain + Technical Analysis
I use on-chain data to identify high-probability zones for technical setups. For example, if blockchain data shows strong accumulation at a certain price level, I'll watch for technical reversal patterns at that level with increased confidence.
On-Chain + Fundamental Analysis
Combining network activity with protocol fundamentals creates a comprehensive investment thesis. Strong fundamentals plus positive on-chain metrics signal exceptional opportunities.
On-Chain + Sentiment Analysis
I look for divergences between on-chain accumulation and negative sentiment—these often create the best buying opportunities. Conversely, when on-chain shows distribution amid euphoric sentiment, it's time to be cautious.

The most successful analysts combine multiple data sources for comprehensive market understanding
Common Pitfalls and How to Avoid Them
Through years of trial and error, I've identified several common mistakes in blockchain analysis:
Common Mistakes
- Overreacting to single data points without context
- Misinterpreting exchange internal transfers as market moves
- Focusing only on Bitcoin while ignoring altcoin on-chain data
- Ignoring the impact of privacy-enhancing technologies
- Data mining—finding patterns that don't actually exist
Best Practices
- Look for convergence across multiple metrics
- Consider the broader market context
- Use entity-adjusted data when possible
- Track metrics over time rather than in isolation
- Combine quantitative data with qualitative understanding
The Future of Blockchain Analysis
As blockchain technology evolves, so too does the sophistication of analysis tools and techniques. Here's what I see developing in the coming years:
- AI-Powered Analytics: Machine learning will identify complex patterns across multiple blockchains simultaneously
- Cross-Chain Analysis: Tools that track capital flows between different blockchain ecosystems
- Real-time Predictive Models: Systems that forecast price movements based on live on-chain data
- Institutional Adoption: More traditional finance firms incorporating blockchain data into investment processes
- Regulatory Integration: Authorities using blockchain analysis for market surveillance and compliance
Conclusion: Making Blockchain Data Work for You
Blockchain data has transformed my approach to crypto investing, providing an objective window into market dynamics that simply doesn't exist in traditional finance. By learning to read on-chain metrics, track smart money movements, and interpret network health, you can develop a significant edge in these volatile markets.
Remember that blockchain analysis is both an art and a science. It requires understanding the technical nuances of different metrics while also developing intuition for how they interact. Start with the basic metrics I've outlined, gradually incorporate more sophisticated tools, and always maintain healthy skepticism about any single data point.
The most successful analysts I know combine blockchain data with other forms of analysis while maintaining flexibility in their interpretations. Markets evolve, and so must our analytical frameworks. But the fundamental transparency of blockchain technology ensures that on-chain analysis will remain a crucial tool for smart money tracking for years to come.

